In the process of automobile assembly, due to the large number of parts, the tightening process and precision have high requirements, in order to ensure the tightening quality of the product, it is usually necessary to accurately find the quality problems from the tightening data. Therefore, it is necessary to make SPC statistical analysis on the tightening data collected in real time, and generate statistical analysis charts in a certain way, so as to scientifically and accurately predict the development trend of the product tightening assembly process and take a reliable way to control the problems generated in the assembly process.
Basic principles of SPC
SPC technology is mainly based on statistical theory. It is assumed that the product quality index X in the production process follows a normal distribution, that is, X ~ N(μ, σ2), P(μ-3σ<X< μ+3σ)=0.9973. It means that in the production process, the probability of quality index X falling in the control chart with μ-3σ and μ+3σ as upper and lower control limits is 99.73%, and the probability of falling outside the control limits is 0.27%. In probability statistics, it is believed that the probability of such a small probability event occurring in an experiment is very small, and if it occurs, it is believed that the existence of system factors leads to this out-of-control state. It is based on this theory that Shewhardt proposed that the stability of the process can be judged by using a control chart, which can be obtained by transforming the normal distribution curve of the actual distribution of product quality characteristic values in the range of 3σ.
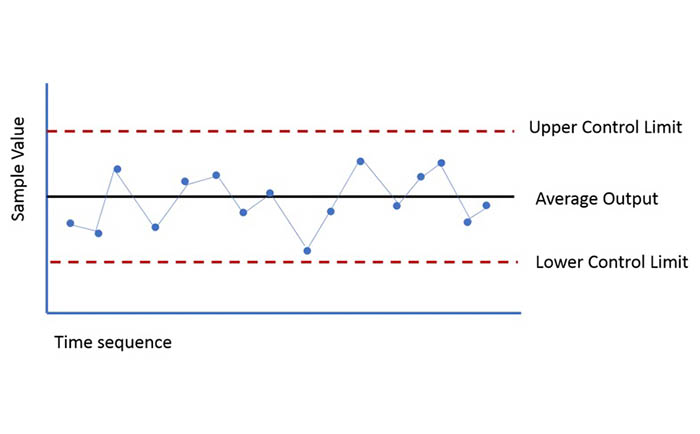
In the process of using the control chart, it is necessary to determine the upper limit of control (UCL), the middle line of control (CL) and the lower limit of control (LCL). Taking into account the economy and practical application of process control and process capability evaluation, most countries currently adopt 3 times standard deviation as the control limit, and 6 sigma has become a higher standard and continuous pursuit of quality management. Therefore, the control limit determination principle of the control chart can be determined:
Upper Control Limit UCL= μ+3σ
Center line CL= μ
Lower Control limit LCL= μ-3σ

Basic structure of control chart
It is generally believed that the causes of quality fluctuations are mainly accidental factors and system factors in two categories: the fluctuations produced only under the action of accidental factors are within the control limit, that is, in a controlled state; When there are system factors, the fluctuation is called abnormal fluctuation. If the fluctuation range exceeds the control limit, the system is considered to be out of control. The control chart shows the change trend of the quality index in the production process, judges the state of the process, finds the abnormal fluctuation in time, and then finds the cause of the fluctuation and takes measures to relieve its influence and improve the product quality.
SPC control flow
The quality control process of bolt tightening based on SPC can be divided into three parts: obtaining key quality data, process control analysis, and improvement measures.
(1) Obtain key quality data. According to the collected bolt tightening data, the bolt torque data is extracted and processed by data classification, outlier removal, missing value processing, Kalman filter noise reduction, etc., to provide data sources for the subsequent SPC quality control.
(2) Process control analysis. Import the above data sources into Minitab, generate the control chart, and carry out the process capability analysis on the process capability chart and the mean range chart to determine whether the current bolt tightening process is controlled. we use the CP value to judge the actual processing capacity of the bolt tightening process.
(3) Improvement measures. What if the quality control CP chart is abnormal, the site will be checked and the cause will be analyzed, and reasonable measures will be taken to adjust the process to improve the overall capacity of the bolt tightening process.
SPC process control function
Bolts in the tightening process will inevitably produce their own quality problems, which will affect the product assembly pass rate, restrict the market competitiveness of the product, and through SPC process control to real-time monitoring of bolt torque, to improve the quality of bolt tightening, to meet the corresponding needs of enterprises:
(1) Reduce the control cost of bolt tightening quality. Avoid the shutdown inspection caused by product quality problems, give full play to the production line capacity, improve production efficiency.
(2) Strengthen the stability of bolt tightening quality. It can quickly and accurately identify the accidental fluctuations and abnormal fluctuations of quality, and carry out scientific analysis and judgment to solve quality problems.
(3) The quality control of bolt tightening is changed from after-the-fact control to process control, to discover and solve the quality problems in time, and to avoid the defective parts entering the next processing station, resulting in greater economic losses.
(4) In the process of bolt tightening, through the analysis and judgment of the process ability, according to the evaluation index of the process ability index, evaluate the process ability of the bolt tightening process and formulate corresponding measures.
At present, all vehicle factories are using SPC to analyze the control ability of bolt tightening process, but SPC is only an analysis tool. Only by combining 5W, fishbone diagram and other problem solving tools to solve the problem at specific torque points can we reliably improve the control ability of bolt tightening process and form a closed-loop solution to the problem. And then produce "high quality", "zero defects" products.


